
PyTorch toolbox to work with spherical surfaces.
Note
This page is a reference documentation. It only explains the function signature, and not how to use it. Please refer to the gallery for the big picture.
-
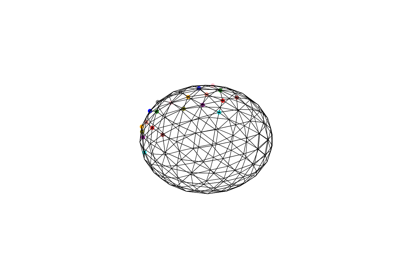
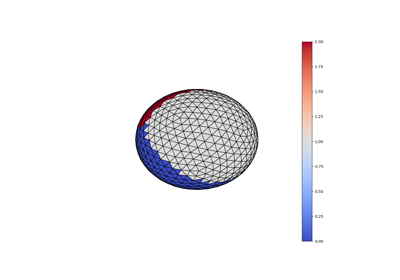
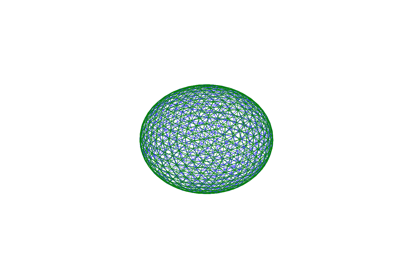
surfify.plotting.surface.plot_trisurf(vertices, triangles, texture=None, vmin=None, vmax=None, colorbar=True, fig=None, ax=None, is_label=False, alpha=1, edgecolors='black')[source]¶ Display a triangular surface.
- Parameters
vertices : array (N, 3)
the surface vertices.
triangles : array (M, 3)
the surface triangles.
texture : array (N,), default None
a texture to display on the surface.
vmin : float, default None
minimum value to map.
vmax : float, default None
maximum value to map.
colorbar : bool, default True
display a colorbar.
fig : Figure, default None
the matplotlib figure.
ax : Axes3D, default None
axis to display the surface plot.
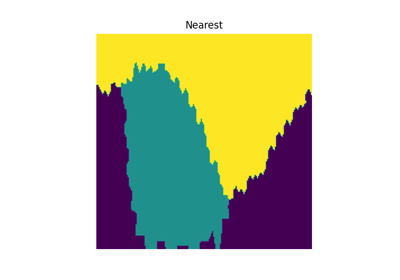
is_label : bool, default False
optionally specify that the texture contains labels in order to use most representative neighboor interpolation.
alpha : float, default 1
number between 0 and 1 defining the opacity of the faces. Not use when texture is None, where alpha is fixed at 0.1
edgecolors : string, default ‘black’
name of the matplotlib color to use for the edges
Follow us