
PyTorch toolbox to work with spherical surfaces.
Note
Click here to download the full example code
Spherical neighbors
Credit: A Grigis
A simple example on how to build spherical neighbors using an icosahedron.
import matplotlib.pyplot as plt
from mpl_toolkits.mplot3d import axes3d
from surfify.utils import icosahedron, neighbors, get_rectangular_projection
from surfify.plotting import plot_trisurf
Out:
/home/docs/checkouts/readthedocs.org/user_builds/surfify/envs/v0.1.0/lib/python3.6/site-packages/nilearn/datasets/__init__.py:96: FutureWarning: Fetchers from the nilearn.datasets module will be updated in version 0.9 to return python strings instead of bytes and Pandas dataframes instead of Numpy arrays.
  "Numpy arrays.", FutureWarning)
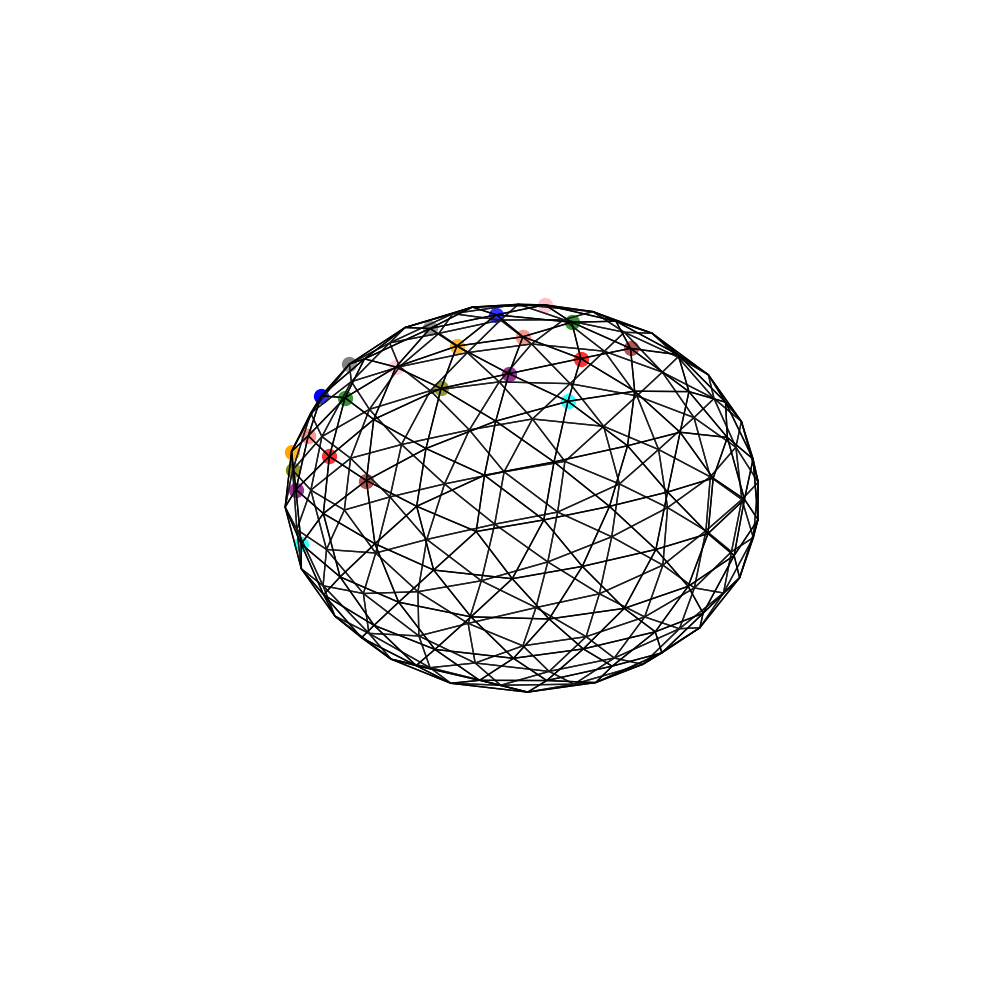
Direct Neighbor
Display direct neighbors for some vertices.
vertices, triangles = icosahedron(order=2)
neighs = neighbors(vertices, triangles, depth=2, direct_neighbor=True)
colors = ["red", "green", "blue", "orange", "purple", "brown", "pink",
          "gray", "olive", "cyan", "yellow", "tan", "salmon", "violet",
          "steelblue", "lime", "navy"] * 5
fig, ax = plt.subplots(1, 1, subplot_kw={
    "projection": "3d", "aspect": "auto"}, figsize=(10, 10))
plot_trisurf(vertices, triangles=triangles, colorbar=False, fig=fig, ax=ax)
for vidx in (0, 4):
    for cnt, idx in enumerate(neighs[vidx]):
        point = vertices[idx]
        ax.scatter(point[0], point[1], point[2], marker="o", c=colors[cnt],
                   s=100)
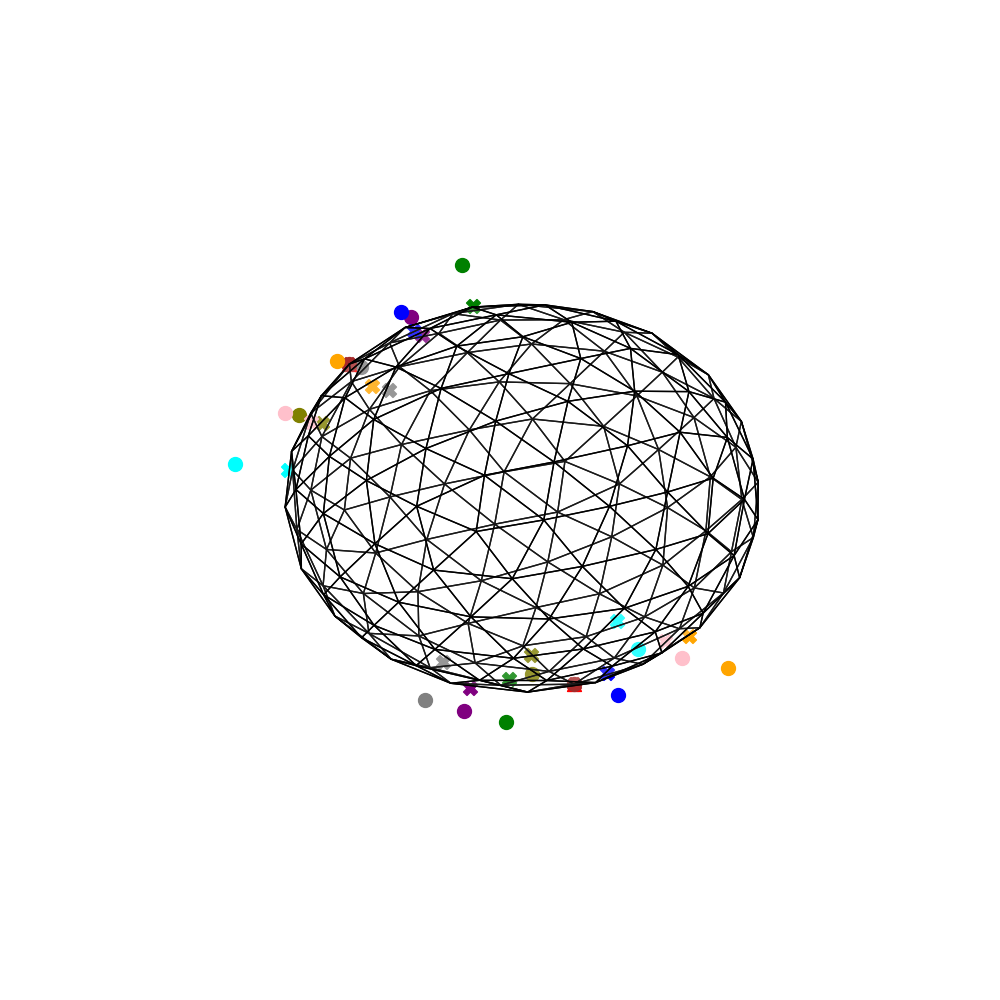
Rectagular Tangent Plane Neighbor
Display 3x3 rectangular tangent plane neighbors for some vertices and the associated projection on the sphere.
zoom = 2
fig, ax = plt.subplots(1, 1, subplot_kw={
        "projection": "3d", "aspect": "auto"}, figsize=(10, 10))
plot_trisurf(vertices, triangles=triangles, fig=fig, ax=ax)
for idx in (13, 40):
    node = vertices[idx]
    node_rec_neighs, node_tplane_neighs = get_rectangular_projection(
        node, size=3, zoom=zoom)
    ax.scatter(node[0], node[1], node[2], marker="^", c=colors[0], s=100)
    for cnt, point in enumerate(node_tplane_neighs):
        ax.scatter(point[0], point[1], point[2], marker="o", c=colors[cnt + 1],
                   s=100)
    for cnt, point in enumerate(node_rec_neighs):
        ax.scatter(point[0], point[1], point[2], marker="X", c=colors[cnt + 1],
                   s=100)

plt.show()
Total running time of the script: ( 0 minutes 1.998 seconds)
Follow us